Traffic Concerns
Traffic-related concerns and complaints are managed by a sergeant within the Field Operations Division who coordinate the efforts of traffic services officers to address concerns.
Our approach encompasses the three E's of traffic safety: education, enforcement and engineering.
- Education: We are dedicated to raising awareness about the dangers of speeding through community outreach and educational programs. Informing drivers about the risks and consequences of speeding is a key component of reducing incidents.
- Enforcement: While it is not feasible for our officers to be present at all times in every location, we use this data to strategically deploy our resources where they are most needed. Enforcement efforts are focused on areas with a history of speeding and accidents.
- Engineering: We continuously assess the design and layout of our roadways to improve safety. This includes considering changes like speed bumps, signage, and other traffic calming measures based on observed data and trends.
We are committed to working diligently to maintain safety and reduce the impact of speeding in our community. We value your understanding and cooperation as we balance resources to address these concerns effectively across all neighborhoods.
Neighborhood Speed Reports
As part of our commitment to ensuring the safety of all road users, we are sharing data from our speed monitoring signs, also known as speed boards. These relocatable signs are strategically placed across the city to gather important data over specific periods, typically ranging from one to two weeks. We understand that seeing instances of speeding in these reports might be concerning. Please be assured that this data is crucial for our ongoing efforts to enhance road safety and is one aspect of our work that informs our speed enforcement strategy.
Brookwood Drive Eastbound, Apr. 2026
From March 19 to April 6, 2026, the City of Fairfax Police Department placed a portable speed board on eastbound Brookwood Drive south of Blenheim Boulevard. In this location, the speed limit is 25 miles per hour (MPH).
During the observation period, the device recorded an average of 27 vehicles per day (a total of 2,673 vehicles) and an average speed of 13.8 MPH. Of the 2,673 vehicles, 697.0% (2,593 vehicles) were traveling at or below the speed limit, 2.9% (78 vehicles) were traveling at one to 10 MPH over the speed limit, 0.0% (one vehicle) were traveling at 11 to 20 MPH over the speed limit, and 0.0% (one vehicle) were traveling at more than 20 MPH over the speed limit.
Graphic representations of this information are available below.
The above bar graph shows vehicle count by speed. Green (the leftmost bar) represents vehicles traveling at or below the speed limit. Yellow (center bar) represents vehicles traveling at one to 10 MPH over the speed limit. Red (second from right bar) represents vehicles traveling 11 to 20 MPH over the speed limit. Black (rightmost bar) represents vehicles traveling 21 or more MPH over the speed limit.
The above map shows where the speed recorder was placed, which was on the west side of Brookwood Drive south of the intersection with Blenheim Boulevard.
Hallman Street Northbound, Apr. 2026
From March 19 to April 3, 2026, the City of Fairfax Police Department placed a portable speed board on southbound Sideburn Road at Forest Avenue. In this location, the speed limit is 25 miles per hour (MPH).
During the observation period, the device recorded an average of 153 vehicles per day (a total of 4,377 vehicles) and an average speed of 21.7 MPH. Of the 4,377 vehicles, 63.1% (2,764 vehicles) were traveling at or below the speed limit, 35.6% (1,557 vehicles) were traveling at one to 10 MPH over the speed limit, 1.3% (55 vehicles) were traveling at 11 to 20 MPH over the speed limit, and 0.0% (one vehicles) were traveling at more than 20 MPH over the speed limit.
Graphic representations of this information are available below.
The above bar graph shows vehicle count by speed. Green (the leftmost bar) represents vehicles traveling at or below the speed limit. Yellow (center bar) represents vehicles traveling at one to 10 MPH over the speed limit. Red (second from right bar) represents vehicles traveling 11 to 20 MPH over the speed limit. Black (rightmost bar) represents vehicles traveling 21 or more MPH over the speed limit.
The above map shows where the speed recorder was placed, which was on the east side of Hallman Street south of the intersection with Main Street.
Main Street Eastbound, Mar. 2026
From February 19 to March 24, 2026, the City of Fairfax Police Department placed a portable speed board on eastbound Main Street at Main Street Marketplace. In this location, the speed limit is 25 miles per hour (MPH).
During the observation period, the device recorded an average of 4,266 vehicles per day (a total of 216,250 vehicles) and an average speed of 27.1 MPH. Of the 216,250 vehicles, 34.5% (74,654 vehicles) were traveling at or below the speed limit, 57.4% (124,073 vehicles) were traveling at one to 10 MPH over the speed limit, 7.9% (17,089 vehicles) were traveling at 11 to 20 MPH over the speed limit, and 0.2% (434 vehicles) were traveling at more than 20 MPH over the speed limit.
Graphic representations of this information are available below.
The above bar graph shows vehicle count by speed. Green (the leftmost bar) represents vehicles traveling at or below the speed limit. Yellow (center bar) represents vehicles traveling at one to 10 MPH over the speed limit. Red (second from right bar) represents vehicles traveling 11 to 20 MPH over the speed limit. Black (rightmost bar) represents vehicles traveling 21 or more MPH over the speed limit.
The above map shows where the speed recorder was placed, which was on the south side of Main Street west of Fairfax Museum and Visitor Center.
Sideburn Road Southbound, March 2026
From February 20 to March 10, 2026, the City of Fairfax Police Department placed a portable speed board on southbound Sideburn Road at Forest Avenue. In this location, the speed limit is 25 miles per hour (MPH).
During the observation period, the device recorded an average of 209 vehicles per day (a total of 17,844 vehicles) and an average speed of 15.8 MPH. Of the 17,844 vehicles, 96.6% (17,243 vehicles) were traveling at or below the speed limit, 3.3% (595 vehicles) were traveling at one to 10 MPH over the speed limit, 0.0% (four vehicles) were traveling at 11 to 20 MPH over the speed limit, and 0.0% (two vehicles) were traveling at more than 20 MPH over the speed limit.
Graphic representations of this information are available below.
The above bar graph shows vehicle count by speed. Green (the leftmost bar) represents vehicles traveling at or below the speed limit. Yellow (center bar) represents vehicles traveling at one to 10 MPH over the speed limit. Red (second from right bar) represents vehicles traveling 11 to 20 MPH over the speed limit. Black (rightmost bar) represents vehicles traveling 21 or more MPH over the speed limit.
The above map shows where the speed recorder was placed, which was on the west side of Sideburn Road south of the intersection with Forest Avenue.
Calvary Drive Eastbound, Jan. 2026
From January 11 to 24, 2026, the City of Fairfax Police Department placed a portable speed board on eastbound Calvary Drive at Scout Drive. In this location, the speed limit is 25 miles per hour (MPH).
During the observation period, the device recorded an average of 19 vehicles per day (a total of 1,510 vehicles) and an average speed of 14.4 MPH. Of the 1,510 vehicles, 97.1% (1,466 vehicles) were traveling at or below the speed limit, 2.7% (41 vehicles) were traveling at one to 10 MPH over the speed limit, 0.1% (one vehicle) was traveling at 11 to 20 MPH over the speed limit, and 0.1% (two vehicles) were traveling at more than 20 MPH over the speed limit.
Graphic representations of this information are available below.
The above bar graph shows vehicle count by speed. Green (the leftmost bar) represents vehicles traveling at or below the speed limit. Yellow (center bar) represents vehicles traveling at one to 10 MPH over the speed limit. Red (second from right bar) represents vehicles traveling 11 to 20 MPH over the speed limit. Black (rightmost bar) represents vehicles traveling 21 or more MPH over the speed limit.
The above map shows where the speed recorder was placed, which was on the south side of Calvary Drive at the intersection with Scout Drive.
Pickett Road Northbound, Jan. 2026
From December 1, 2025, to January 23, 2026, the City of Fairfax Police Department placed a portable speed board on northbound Pickett Road at the entry to Pickett Reserve. In this location, the speed limit is 35 miles per hour (MPH).
During the observation period, the device recorded an average of 4,415 vehicles per day (a total of 376,653 vehicles) and an average speed of 37 MPH. Of the 376,653 vehicles, 36.6% (137,851 vehicles) were traveling at or below the speed limit, 57.9% (217,991 vehicles) were traveling at one to 10 MPH over the speed limit, 5.3% (20,098 vehicles) were traveling at 11 to 20 MPH over the speed limit, and 0.2% (713 vehicles) were traveling at more than 20 MPH over the speed limit.
Graphic representations of this information are available below.
The above bar graph shows vehicle count by speed. Green (the leftmost bar) represents vehicles traveling at or below the speed limit. Yellow (center bar) represents vehicles traveling at one to 10 MPH over the speed limit. Red (second from right bar) represents vehicles traveling 11 to 20 MPH over the speed limit. Black (rightmost bar) represents vehicles traveling 21 or more MPH over the speed limit.
The above map shows where the speed recorder was placed, which was on the east side of Pickett Road by the entrance to Pickett Reserve.
Maple Street Westbound, Nov. 2025
From November 7 to 20, 2025, the City of Fairfax Police Department placed a portable speed board on westbound Maple Street east of Cupp Drive. In this location, the speed limit is 25 miles per hour (MPH).
During the observation period, the device recorded an average of 337 vehicles per day (a total of 16,128 vehicles) and an average speed of 17 MPH. Of the 16,128 vehicles, 94.2% (15,186 vehicles) were traveling at or below the speed limit, 5.8% (929 vehicles) were traveling at one to 10 MPH over the speed limit, 0.1% (10 vehicles) were traveling at 11 to 20 MPH over the speed limit and 0.0% (3 vehicles) were traveling at more than 20 MPH over the speed limit.
Graphic representations of this information are available below.
The above bar graph shows vehicle count by speed. Green (the leftmost bar) represents vehicles traveling at or below the speed limit. Yellow (center bar) represents vehicles traveling at one to 10 MPH over the speed limit. Red (second from right bar) represents vehicles traveling 11 to 20 MPH over the speed limit. Black (rightmost bar) represents vehicles traveling 21 or more MPH over the speed limit.
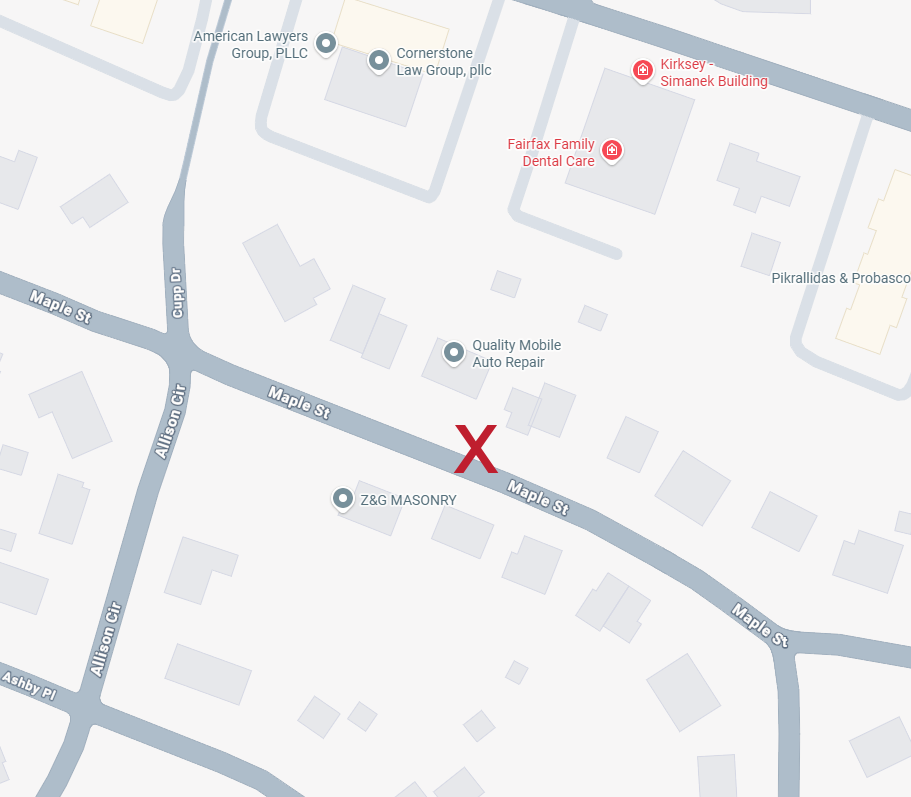
The above map shows where the speed recorder was placed, which was on the north side of Maple Street east of Cupp Drive.
School Street Eastbound, Nov. 2025
From October 24 to November 5, 2025, the City of Fairfax Police Department placed a portable speed board on eastbound School Street just east of High Oak Lane. In this location, the speed limit is 25 miles per hour (MPH).
During the observation period, the device recorded an average of 373 vehicles per day (a total of 10,797 vehicles) and an average speed of 19.1 MPH. Of the 10,797 vehicles, 78.9% (8,515 vehicles) were traveling at or below the speed limit, 20.8% (2,251 vehicles) were traveling at one to 10 MPH over the speed limit, 0.3% (31 vehicles) were traveling at 11 to 20 MPH over the speed limit and 0.0% (no vehicles) were traveling at more than 20 MPH over the speed limit.
Graphic representations of this information are available below.
The above bar graph shows vehicle count by speed. Green (the leftmost bar) represents vehicles traveling at or below the speed limit. Yellow (center bar) represents vehicles traveling at one to 10 MPH over the speed limit. Red (second from right bar) represents vehicles traveling 11 to 20 MPH over the speed limit. Black (rightmost bar) represents vehicles traveling 21 or more MPH over the speed limit.
The above map shows where the speed recorder was placed, which was on the south side of School Street between High Oak Lane and George Mason Boulevard.
Sideburn Road Southbound, Nov. 2025
From October 24 to November 5, 2025, the City of Fairfax Police Department placed a portable speed board on southbound Sideburn Road between Darby and Cleveland Streets. In this location, the speed limit is 25 miles per hour (MPH).
During the observation period, the device recorded an average of 1,876 vehicles per day (a total of 24,469 vehicles) and an average speed of 16.9 MPH. Of the 24,469 vehicles, 93.7% (22,916 vehicles) were traveling at or below the speed limit, 6.3% (1,536 vehicles) were traveling at one to 10 MPH over the speed limit, 0.1% (17 vehicles) were traveling at 11 to 20 MPH over the speed limit and 0.0% (no vehicles) were traveling at more than 20 MPH over the speed limit.
Graphic representations of this information are available below.
The above bar graph shows vehicle count by speed. Green (the leftmost bar) represents vehicles traveling at or below the speed limit. Yellow (center bar) represents vehicles traveling at one to 10 MPH over the speed limit. Red (second from right bar) represents vehicles traveling 11 to 20 MPH over the speed limit. Black (rightmost bar) represents vehicles traveling 21 or more MPH over the speed limit.
The above map shows where the speed recorder was placed, which was on the west side of Sideburn Road between Darby and Cleveland Streets.
Fairfax Boulevard Eastbound, Oct. 2025
From August 16 to October 15, 2025, the City of Fairfax Police Department placed speed recorders on eastbound Fairfax Boulevard just east of Gateway Drive. In this location, the speed limit is 35 miles per hour (MPH).
During the observation period, the device recorded an average of 6,894 vehicles per day (a total of 421,180 vehicles) and an average speed of 31.6 MPH. Of the 421,180 vehicles, 68.5% (288,376 vehicles) were traveling at or below the speed limit, 29.9% (126,020 vehicles) were traveling one to 10 miles over the speed limit, 1.6% (6,577 vehicles) were traveling 11 to 20 MPH over the speed limit, and with 0.0% (207 vehicles) traveling at speeds greater than 21 MPH over the speed limit.
Graphic representations of this info are available below.
The above bar graph shows vehicle count by speed. Green (the leftmost bar) represents vehicles traveling at or below the speed limit. Yellow (center bar) represents vehicles traveling at one to 10 MPH over the speed limit. Red (second from right bar) represents vehicles traveling 11 to 20 MPH over the speed limit. Black (rightmost) represents vehicles traveling 21 MPH or more over the speed limit.
The above map shows where the speed recorder was placed, which was on the south side of Fairfax Boulevard to the west of Gateway Drive.
Queen Anne Drive Westbound, Sept. 2025
From September 4 to 18, 2025, the City of Fairfax Police Department placed speed recorders on westbound Queen Anne Drive between Blenheim Boulevard and Colony Road. In this location, the speed limit is 25 miles per hour (MPH).
During the observation period, the device recorded an average of 291 vehicles per day (a total of 4,450 vehicles) and an average speed of 20.4 MPH. Of the 4,450 vehicles, 79.4% (3,533 vehicles) were traveling at or below the speed limit, 20.3% (903 vehicles) were traveling one to 10 miles over the speed limit, 0.3% (14 vehicles) were traveling 11 to 20 MPH over the speed limit, and with 0.0% (no vehicles) traveling at speeds greater than 21 MPH over the speed limit.
Graphic representations of this info are available below.

The above bar graph shows vehicle count by speed. Green (the leftmost bar) represents vehicles traveling at or below the speed limit. Yellow (center bar) represents vehicles traveling at one to 10 MPH over the speed limit. Red (second from right bar) represents vehicles traveling 11 to 20 MPH over the speed limit. Black (rightmost) represents vehicles traveling 21 MPH or more over the speed limit.

The above map shows where the speed recorder was placed, which was on the north side of Queen Anne Drive, between Blenheim Boulevard and Colony Road.
Bevan Drive Northbound, Aug. 2025
From August 21 to September 2, 2025, the City of Fairfax Police Department placed speed recorders on northbound Bevan Drive between Fairchester and Woodhaven Drives. In this location, the speed limit is 25 miles per hour (MPH).
During the observation period, the device recorded an average of 2,577 vehicles per day (a total of 33,555 vehicles) and an average speed of 21.6 MPH. Of the 33,555 vehicles, 74.4% (24,949 vehicles) were traveling at or below the speed limit, 25.1% (8,429 vehicles) were traveling one to 10 miles over the speed limit, 0.5% (177 vehicles) were traveling 11 to 20 MPH over the speed limit, and with 0.0% (no vehicles) traveling at speeds greater than 21 MPH over the speed limit.
Graphic representations of this info are available below.

The above bar graph shows vehicle count by speed. Green (the leftmost bar) represents vehicles traveling at or below the speed limit. Yellow (second from left bar) represents vehicles traveling at one to 10 MPH over the speed limit. Red (second from right bar) represents vehicles traveling 11 to 20 MPH over the speed limit. Black (rightmost bar) represents vehicles traveling 21 MPH or more over the speed limit.

The above map shows where the speed recorder was placed, which was on the east side of Bevan Drive, north of Fairchester Drive and south of Woodhaven Drive.
Eaton Place Eastbound, Aug. 2025
From August 21 to September 9, 2025, the City of Fairfax Police Department placed speed recorders on northbound Eaton Place just east of University Drive. In this location, the speed limit is 25 miles per hour (MPH).
During the observation period, the device recorded an average of 2,498 vehicles per day (a total of 49,951 vehicles) and an average speed of 25.7 MPH. Of the 49,951 vehicles, 37.0% (18,485 vehicles) were traveling at or below the speed limit, 55.2% (27,595 vehicles) were traveling one to 10 miles over the speed limit, 7.5% (3,768 vehicles) were traveling 11 to 20 MPH over the speed limit, and with 0.2% (103) traveling at speeds greater than 21 MPH over the speed limit.
Graphic representations of this info are available below.
The above bar graph shows vehicle count by speed. Green (the leftmost bar) represents vehicles traveling at or below the speed limit. Yellow (second from left bar) represents vehicles traveling at one to 10 MPH over the speed limit. Red (second from right bar) represents vehicles traveling 11 to 20 MPH over the speed limit. Black (rightmost bar) represents vehicles traveling 21 MPH or more over the speed limit.
The above map shows where the speed recorder was placed, which was on the south side of Eaton Place, east of University Drive.
Blenheim Boulevard Southbound at Parklane Road, July 2025
From July 19 to August 18, 2025, the City of Fairfax Police Department placed speed recorders on southbound Blenheim Boulevard at Parklane Road. In this location, the speed limit is 30 miles per hour (MPH).
During the observation period, the device recorded an average of 4,244 vehicles per day (a total of 131,955 vehicles) and an average speed of 28 MPH. Of the 131,955 vehicles, 71.1% (93,819 vehicles) were traveling at or below the speed limit, 28.1% (37,071 vehicles) were traveling one to 10 miles over the speed limit, 0.8% (1,024 vehicles) were traveling 11 to 20 MPH over the speed limit, and with 0.0% (41 vehicles) traveling at speeds greater than 21 MPH over the speed limit.
Graphic representations of this info are available below.
The above bar graph shows vehicle count by speed. Green (the leftmost bar) represents vehicles traveling at or below the speed limit. Yellow (center bar) represents vehicles traveling at one to 10 MPH over the speed limit. Red (second from right bar) represents vehicles traveling 11 to 20 MPH over the speed limit. Black (rightmost bar) represents vehicles traveling 21 MPH or more over the speed limit.
The above map shows where the speed recorder was placed, which was on the west side of Blenheim Boulevard at Parklane Road.
Jermantown Road Southbound, July 2025
From July 1 through July 31, 2025, the City of Fairfax Police Department placed speed recorders on southbound Jermantown Road between Fairhaven Court and Copper Lane. In this location, the speed limit is 30 miles per hour (MPH).
During the observation period, the device recorded an average of 4,870 vehicles per day (a total of 151,093 vehicles) and an average speed of 26.9 MPH. Of the 151,093 vehicles, 76% (114,888 vehicles) were traveling at or below the speed limit, 23.6% (35,697 vehicles) were traveling one to 10 miles over the speed limit, 0.3% (499 vehicles) were traveling 11 to 20 MPH over the speed limit, and with 0.0% (nine vehicles) traveling at speeds greater than 21 MPH over the speed limit.
Graphic representations of this information are available below.

The above bar graph shows vehicle count by speed. Green (the leftmost bar) represents vehicles traveling at or below the speed limit. Yellow (center bar) represents vehicles traveling at one to 10 MPH over the speed limit. Red (second from right bar) represents vehicles traveling 11 to 20 MPH over the speed limit. Black (rightmost bars) represents vehicles traveling 21 MPH or more over the speed limit.

The above map shows where the speed recorder was placed, which was on the west side of Jermantown Road, north of Copper Lane and south of Fairhaven Court.
Fairfax Boulevard Eastbound at Spring Street, July 2025
From July 1 through 31, 2025, the City of Fairfax Police Department placed speed recorders on eastbound Fairfax Boulevard at Spring Street. In this location, the speed limit is 35 miles per hour (MPH).
During the observation period, the device recorded an average of 9,208 vehicles per day (a total of 285,576 vehicles) and an average speed of 31.1 MPH. Of the 285,576 vehicles, 70.3% (200,654 vehicles) were traveling at or below the speed limit, 27.7% (79,095 vehicles) were traveling over the speed limit, 1.9% (5,506 vehicles) were traveling at 11 or more MPH over the speed limit, and 0.1% (321 vehicles) were traveling 20 or more MPH over the speed limit.
Graphic representations of this information are available below.

The above bar graph shows vehicle count by speed. Green (leftmost bar) represents vehicles traveling at or below the speed limit. Yellow (second from left bar) represents vehicles traveling at one to 10 MPH over the speed limit. Red (rightmost bar) represents vehicles traveling 11 to 20 MPH over the speed limit.

The above map shows where the speed recorder was placed, which was on the south side of Fairfax Boulevard at the western entrance for Fairfax Circle Shopping Center.
Chestnut Street Southbound, June 2025
From June 18 through July 6, 2025, the City of Fairfax Police Department placed speed recorders on southbound Chestnut Street between Park Road and Oakwood Drive. In this location, the speed limit is 25 miles per hour (MPH).
During the observation period, the device recorded an average of 666 vehicles per day (a total of 12,754 vehicles) and an average speed of 19 MPH. Of the 12,754 vehicles, 86% (10,970 vehicles) were traveling at or below the speed limit, 13.8% (1,764 vehicles) were traveling one to 10 miles over the speed limit, 0.1% (19 vehicles) were traveling 11 to 20 MPH over the speed limit, and 0.0% (one vehicle) were traveling at speeds greater than 21 MPH over the speed limit.
Graphic representations of this information are available below.

The above bar graph shows vehicle count by speed. Green (the leftmost bar) represents vehicles traveling at or below the speed limit. Yellow (center bar) represents vehicles traveling at one to 10 MPH over the speed limit. Red (second from right bar) represents vehicles traveling 11 to 20 MPH over the speed limit. Black (rightmost bar) represents vehicles traveling 21 or more MPH over the speed limit.

The above map shows where the speed recorder was placed, which was on the east side of Chestnut Street, north of Oakwood Drive and south of Park Road.
Bevan Drive Southbound, June 2025
From June 3 through 23, 2025, the City of Fairfax Police Department placed speed recorders on southbound Bevan Drive between Fairchester and Woodhaven Drives. In this location, the speed limit is 25 miles per hour (MPH).
During the observation period, the device recorded an average of 745 vehicles per day (a total of 15,406 vehicles) and an average speed of 21.9 MPH. Of the 15,406 vehicles, 84.3% (11,006 vehicles) were traveling at or below the speed limit, 28% (4,311 vehicles) were traveling one to 10 miles over the speed limit, 0.6% (85 vehicles) were traveling 11 to 20 MPH over the speed limit, and with 0.0% (four vehicles) traveling at speeds greater than 21 MPH over the speed limit.
Graphic representations of this info are available below.

The above bar graph shows vehicle count by speed. Green (leftmost bar) represents vehicles traveling at or below the speed limit. Yellow (second from left bar) represents vehicles traveling at one to 10 MPH over the speed limit. Red (second from right bar) represents vehicles traveling 11 to 20 MPH over the speed limit. Black (rightmost bar) represents vehicles traveling 21 or more MPH over the speed limit
The above map shows where the speed recorder was placed, which was on the east side of Bevan Drive, north of Fairchester Drive and south of Woodhaven Drive.
Estel Road Northbound at Mode Street, Apr. 2025
From April 14 through May 4, 2025, the City of Fairfax Police Department placed a portable speed board in the 3800 block of northbound Estel Road at Mode Street. In this location, the speed limit is 25 miles per hour (MPH).
During the observation period, the device recorded an average of 482 vehicles per day (a total of 10,312 vehicles) and an average speed of 18.8 MPH. Of the 10,312 vehicles, 84.3% (8,697 vehicles) were traveling at or below the speed limit, 15.3% (1,577 vehicles) were traveling at one to 10 MPH over the speed limit, 0.35% (33 vehicles) were traveling at 11 to 20 MPH over the speed limit and 0.02% (three vehicles) were traveling at more than 20 MPH over the speed limit.
Graphic representations of this information are available below.

The above bar graph shows vehicle count by speed. Green (the leftmost bar) represents vehicles traveling at or below the speed limit. Yellow (center bar) represents vehicles traveling at one to 10 MPH over the speed limit. Red (second from right bar) represents vehicles traveling 11 to 20 MPH over the speed limit. Black (rightmost bar) represents vehicles traveling 21 or more MPH over the speed limit.

The above map shows where the speed recorder was placed, which was on the east side of Estel Road at Mode Street.
Bevan Drive Northbound, May 2025
From May 1 through 29, 2025, the City of Fairfax Police Department placed speed recorders on northbound Bevan Drive between Fairchester and Woodhaven Drives. In this location, the speed limit is 25 miles per hour (MPH).
During the observation period, the device recorded an average of 1,252 vehicles per day (a total of 25,030 vehicles) and an average speed of 22.6 MPH. Of the 25,030 vehicles, 84.3% (17,168 vehicles) were traveling at or below the speed limit, 30.8% (7,719 vehicles) were traveling one to 10 miles over the speed limit, 0.6% (138 vehicles) were traveling 11 to 20 MPH over the speed limit, and with 0.0% (five vehicles) traveling at speeds greater than 21 MPH over the speed limit.
Graphic representations of this info are available below.

The above bar graph shows vehicle count by speed. Green (leftmost bar) represents vehicles traveling at or below the speed limit. Yellow (second from left bar) represents vehicles traveling at one to 10 MPH over the speed limit. Red (second from right bar) represents vehicles traveling 11 to 20 MPH over the speed limit. Black (rightmost bar) represents vehicles traveling 21 or more MPH over the speed limit
The above map shows where the speed recorder was placed, which was on the east side of Bevan Drive, north of Fairchester Drive and south of Woodhaven Drive.
Sideburn Road Southbound at Forest Avenue, Mar. 2025
From March 19 to 26, 2025, the City of Fairfax Police Department placed a portable speed board southbound Sideburn Road at Forest Avenue. In this location, the speed limit is 25 miles per hour (MPH).
During the observation period, the device recorded an average of 610 vehicles per day (a total of 4,796 vehicles) and an average speed of 18.5 MPH. Of the 4,796 vehicles, 90.2% (4,327 vehicles) were traveling at or below the speed limit, 9.6% (461 vehicles) were traveling at one to 10 MPH over the speed limit, 0.2% (8 vehicles) were traveling at 11 to 20 MPH over the speed limit and 0.0% (no vehicles) were traveling at more than 20 MPH over the speed limit.
Graphic representations of this information are available below.

The above bar graph shows vehicle count by speed. Green (the leftmost bar) represents vehicles traveling at or below the speed limit. Yellow (center bar) represents vehicles traveling at one to 10 MPH over the speed limit. Red (second from right bar) represents vehicles traveling 11 to 20 MPH over the speed limit. Black (rightmost bar) represents vehicles traveling 21 or more MPH over the speed limit.

The above map shows where the speed recorder was placed, which was on the west side of Sideburn Road at Forest Drive.
Eaton Place Eastbound, Mar. 2025
From March 2 to April 10, 2025, the City of Fairfax Police Department placed a portable speed board in the 10300 block of eastbound Eaton Place. In this location, the speed limit is 25 miles per hour (MPH).
During the observation period, the device recorded an average of 2,623 vehicles per day (a total of 93,038 vehicles) and an average speed of 25.7 MPH. Of the 93,038 vehicles, 37.4% (34,761 vehicles) were traveling at or below the speed limit, 54.9% (51,052 vehicles) were traveling at one to 10 MPH over the speed limit, 7.5% (7,008 vehicles) were traveling at 11 to 20 MPH over the speed limit and 0.2% (217 vehicles) were traveling at more than 20 MPH over the speed limit.
Graphic representations of this information are available below.

The above bar graph shows vehicle count by speed. Green (the leftmost bar) represents vehicles traveling at or below the speed limit. Yellow (center bar) represents vehicles traveling at one to 10 MPH over the speed limit. Red (second from right bar) represents vehicles traveling 11 to 20 MPH over the speed limit. Black (rightmost bar) represents vehicles traveling 21 or more MPH over the speed limit.

The above map shows where the speed recorder was placed, which was on the south side of Eaton Place just east of University Drive.
Main Street Northbound at Railroad Avenue, Dec. 2024
From December 11, 2024, through March 11, 2025, the City of Fairfax Police Department placed speed recorders on northbound Main Street at Railroad Avenue. In this location, the speed limit is 35 miles per hour (MPH).
During the observation period, the device recorded an average of 7,773 vehicles per day (a total of 706,152 vehicles) and an average speed of 32.8 MPH. Of the 706,152 vehicles, 38.7% (273,367) were traveling at more than 35 MPH, and 1.5% (10,358 vehicles) were traveling at 11 or more MPH over the speed limit.
The above map shows where the speed recorder was placed, which was just south of Railroad Avenue on the east of the street near 10610 Main Street.
Fairfax Boulevard Westbound at Spring Street, Dec. 2024
From December 10, 2024, through March 11, 2025, the City of Fairfax Police Department placed speed recorders on westbound Fairfax Boulevard at Spring Street. In this location, the speed limit is 35 miles per hour (MPH).
During the observation period, the device recorded an average of 8,540 vehicles per day (a total of 786,673 vehicles) and an average speed of 29.6 MPH. Of the 786,673 vehicles, 78.7% (618,111 vehicles) were traveling at or below the speed limit, 21.3% (167,399 vehicles) were traveling over the speed limit, with 0.6% (4,991 vehicles) traveling at 11 or more MPH over the speed limit.
The above map shows where the speed board was located, immediately west of Spring Street on the north side of Fairfax Boulevard.
Contact Us
When contacting the police department, please be as detailed as possible to help us fully understand the issue and provide the necessary information to allow us to take proper action. Also, please provide your name and a daytime phone number or an email address so we can contact you for additional information, if necessary.
Requests will be answered Monday-Friday during business hours. Please allow 1-3 business days for a response from the proper team.
The below email addresses are not checked 24/7 and should not be used to report crimes in progress. For emergencies, or other real-time issues, please contact 911 or our non-emergency number at 703-385-7924.
Traffic Concerns/Complaints
Community Services Division (Traffic Services Section)
trafficcomplaints@fairfaxva.gov